History of Social Network Theory
So when did Social Network theory and data analysis start?
Definetely, it has been around for a while, but the majority of social scientists cite Milgram’s small world experiment.
In the 60's (long before the Internet), Milgram asked people from the Boston area to send a letter to a person they didn’t know (Backstrom et al., 2012). They had to route the message to a personal acquaintance that was more likely than the sender to know the target person (Blackstrom et al., 2012). It turned out, that an average number of intermediaries was close to 6 “degrees of separation”( (Backstrom et al., 2012)
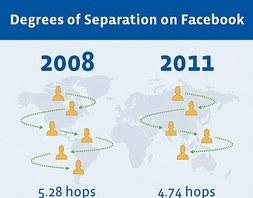
The 6 degrees of separation hypothesis was further supported in 2008 on Facebook data (Blackstrom et al., 2012). It was also tested on MSN messenger and the average path length turned to be 6.6 (Aggarwal et al. 2012). However, a more recent study in 2011 showed that Facebook now has 4 degrees of separation (Blackstrom et al., 2012).
So our world becomes smaller as people become more connected!
Definetely, it has been around for a while, but the majority of social scientists cite Milgram’s small world experiment.
In the 60's (long before the Internet), Milgram asked people from the Boston area to send a letter to a person they didn’t know (Backstrom et al., 2012). They had to route the message to a personal acquaintance that was more likely than the sender to know the target person (Blackstrom et al., 2012). It turned out, that an average number of intermediaries was close to 6 “degrees of separation”( (Backstrom et al., 2012)
The 6 degrees of separation hypothesis was further supported in 2008 on Facebook data (Blackstrom et al., 2012). It was also tested on MSN messenger and the average path length turned to be 6.6 (Aggarwal et al. 2012). However, a more recent study in 2011 showed that Facebook now has 4 degrees of separation (Blackstrom et al., 2012).
So our world becomes smaller as people become more connected!
Social network Analysis background
Social networks are networks of interactions or relationships (edges) of different actors.
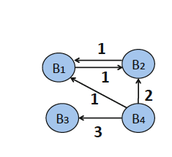
Social networks size (or degree, number of nodes) is usually represented in graphical models that illustrate how nodes (actors) and their ties (edges, connections), form circles (clusters, cliques) and social scientists can estimate density and diameter of these networks (Scott, 2000). For a given graph on the left, diameter is the maximum distance between any two nodes B1 and B3 represents how much of a small world a graph is (McGlohon et al., 2012)
"Online social networks can be represented as weighted graphs of the form:
G(V,E,W) from this data, where V is the set of n nodes, E is the set of edges and W is the edge weight matrix. We also let Y to be a set of m labels that can be applied to nodes of the graph" (Bhagat et al., 2011, p. 120)
For example, a graph representation of the Facebook social network in the form G(V, E, W) will have:
-Nodes V: the set of nodes V will represent Facebook users
-Edges E: a relationships between two nodes could represent various possibilities such as a simple relationships (friend, relative,partner), interaction (wall post), activity ( tagging in a photo), and others. Usually it is simplified to friendship
-Edge Weights W: the weight on an edge is used to indicate the strength of the connection (such as weak ties & strong ties)
-Node labels Y: can include additional information such as user's interests, demographics, occupation, etc. (Bhagat et al., 2011)
By understanding these essential social network components, we can understand how scientists come up with algorithms that help one to visualize and analyze social networks.

The major problem in social network analysis is of community detection to find structurally related clusters in networks (Aggarwall, 2011) As most of us know, homophily is a tendency for people to become friends with others like themselves due to similar sociodemographic characteristics, common ties, similar experiences, etc (Scott, 2000). Most networks have strong modular or community structure and often have multiple communities within communities (McGlohon et al. 2011). Scientists designed various hierarchical scalable algorithms that are able to detect major communities in our networks (Ruan et al. 2011) Freeman, an American sociologist, discovered an important parameter of betweenness centrality, which represents the shortest path from all edges that pass through the node, or the number of times this node acts as a bridge between two other nodes (Ruan et al.2011) It is important not to confuse it with node centrality- a measure of the importance of a node (Bhagat et al., 2011)
We will see that these parameters are very useful for detecting central clusters and nodes in your social network.
To summarize, here are 3 universal properties of social networks:
1) As more nodes are added to the network, its diameter shrinks making the small world even smaller (McGlohon et al. 2011)
2) Social networks have heavy-tailed degree distribution where most nods have few neighbourhoods, and there are a few large clusters (McGlohon et al. 2011)
3) social networks have strong modular or community-like structure with various interconnected clusters
Unfortunately, I can't go into more detail on social network structure, properties, and algorithms, but I recommend the books and source I cited below if you are interested in learning more.

Granovetter

My favourite empirical study on Social Networks was done by Mark Granovetter in the 70's.
Granovetter surveyed a random sample of people living in Boston area and asked them how they found their last job (1973). Since about half of people in his sample found a job through networking, he performed a subsequent study on the nature of their networking relationships (Granovetter, 1973). Granovetter found that most of these job information contacts are weak ties, which are people his respondents interacted rarely with on a day-to-day basis (1973). This led to the development of his theory that weak ties pass useful information more easily than strong ties or people you know well (Granovetter, 1973). He argued that weak ties are more likely to bring new job information from other clusters rather than redundant information that already exists in clusters (Granovetter, 1973).
Overall, Granovetter’s famous study led to:
1) realization that social networks' structure and weak ties really matter
2) realization that the labour market does not always rationally match people to jobs , since job information is often acquired accidentally
3) many subsequent sociological studies that tested this theory with advanced graphical and mathematical models. For example, check out
Sources:

Scholars:
Aggarwal, C. C. (2011). An Introduction to Social Network Data Analytics.Social Network Data Analytics, 1-15.
Backstrom, L., Boldi, P., Rosa, M., Ugander, J., & Vigna, S. (2011). Four degrees of separation. arXiv preprint arXiv:1111.4570.
Granovetter, Mark S. (1973). The strength of weak ties. American journal of Sociology 78:1360-1380.J. Ugander, B. Karrer, L. Backstrom, C. Marlow.Parthasarathy, S., Ruan, Y., & Satuluri, V. (2011). Community discovery in social networks: Applications, methods and emerging trends. Social Network Data Analytics, 79-113.
Scott, J. (2000). Social network analysis: a handbook (2nd ed.). London: Sage Publications.
Stanley Milgram. The small world problem. Psychology Today, 2(1):60–67, 1967.
McGlohon, M., Akoglu, L., & Faloutsos, C. (2011). Statistical properties of social networks. Social Network Data Analytics, 17-42. Bhagat, S., Cormode, G., & Muthukrishnan, S. (2011). Node classification in social networks. Social Network Data Analytics, 115-148.
Link to the book: http://link.springer.com/book/10.1007/978-1-4419-8462-3/page/1
Article: http://saypeople.com/2011/11/22/facebook-has-decreased-six-degrees-of-separation-to-four/#ixzz2NLk7bOTA
Pictures: http://blogs.scientificamerican.com/cocktail-party-physics/files/2012/06/800px-Six_degrees_of_separation.svg_-300x225.png
http://www.niteshambuj.com/wp-content/uploads/2009/11/Human-Web-Six-Steps1.JPG
http://www.news.cornell.edu/chronicle/04/9.30.04/Granovetter.jpghttp://www.cartoonstock.com/newscartoons/cartoonists/mly/lowres/mlyn211l.jpghttps://collaboration.vbi.vt.edu/download/attachments/35915499/social-network-connect-media.jpg?version=1&modificationDate=1274991764000
